Create Maps and Display Data Online
SuperMap Online Cloud Application provides a variety of online WebApps. Register and login your SuperMap Online account, and you can use these WebApps to create maps, analyze data. You can also share map results with others, or apply for nominating resources. For example, you can:
- Use data to create a map in DataViz
- Build a data visualization application in MapDashboard
- Explore the value of data in DataInsights
- Visualize and analyze massive data in MapStudio
- Create 3D scene in iEarth
Create and display a map in DataViz
This example will lead you to quickly create and share the following map in DataViz. Click to learn more functions of DataViz. 
Step1 Open DataViz
Here are two ways to open DataViz. In the SuperMap Online top navigation bar, you can:
- Click 'Web Application' > 'DataViz' > 'Get Started' to open DataViz.
- Click 'GIS Store' > 'Resource' > 'Start Creating' > 'DataViz' to open DataViz.
Step2 Upload GIS data
In DataViz, click 'Upload' to select and upload your GIS data. DataViz supports uploading spatial data in CSV/EXCEL/GeoJSON formats, etc. 
Step3 Create a map
After uploading data, you can create different types of thematic maps. In this example, we select 'Heat Map', you can modify theme weight field, heat color and so on.  You can add a legend. Click DataViz icon on the top left corner, then click 'Legend' on the corresponding layer in the layer list to display the legend.
Step4 Save and share the map
Click 'Save' button, fill in the map name, label and other information to save your map. After saving, you can click 'Share' button to share the map with others in the form of link or QR code. 
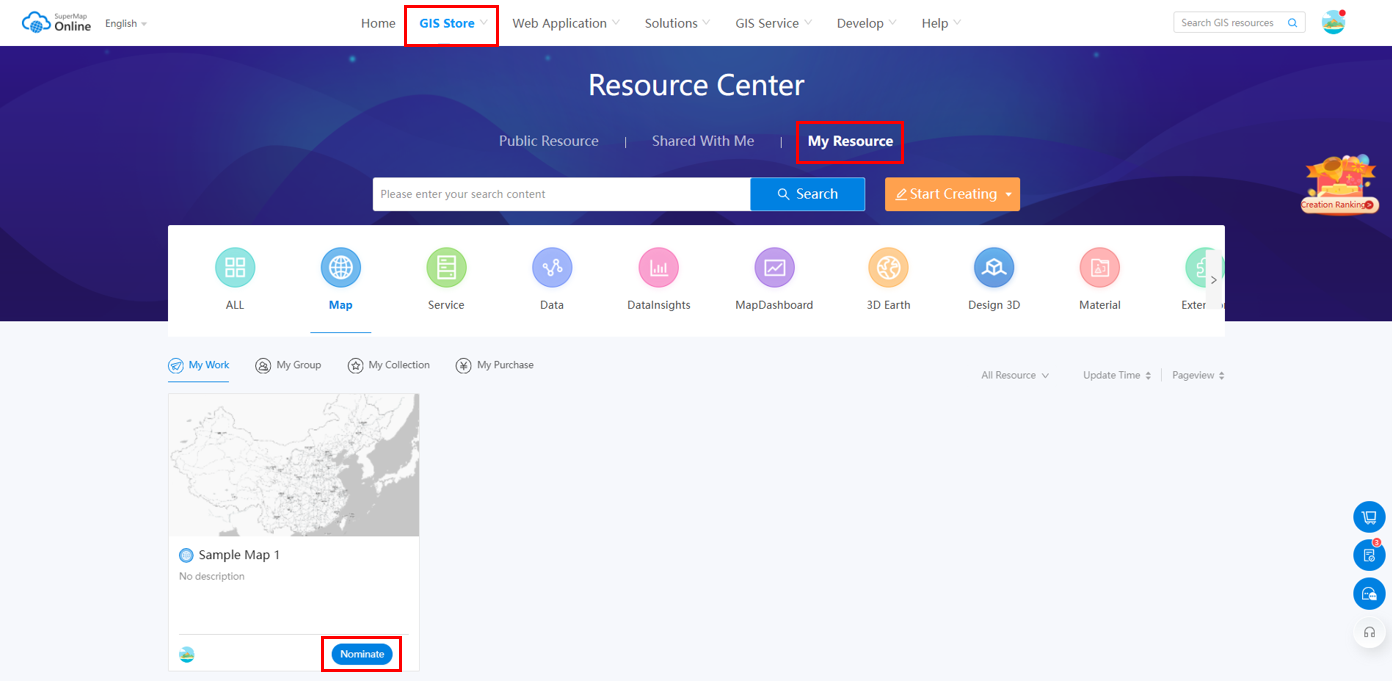
Step5 Nominate the map
You can find your map results in 'GIS Store' > 'Resource' > 'My Resource'. Click 'Nominate' and fill in the relevant information, such as Name, Description, etc., then you can submit your resource and it will displayed in Public Resouce. Resources that are successfully submited will bring you points, and you can also receive corresponding points when others purchase your resources.