MapStudio
The general operational process of MapStudio includes: Create Project, Choose Base Map, Add Layer, Add Data, Modify Layer Properties, Analyze Data, Save and Share.
Create Project
You can click MapStudio in the application center, and click 'Get Started' in the pop-up page. You can also click 'Resource Center' > 'Map' > 'Create Map' > 'MapStudio' to open MapStudio. In the resource center, you can view or edit the map you have saved.
Choose Base Map
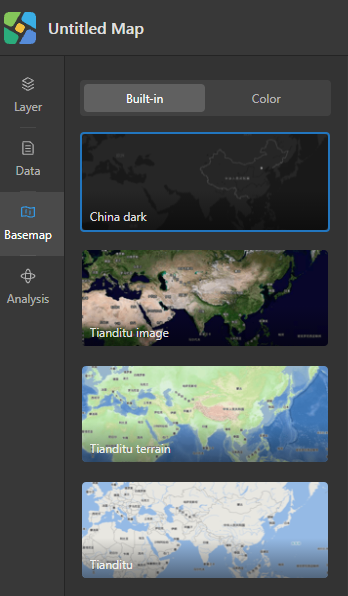
The MapStudio set the China dark as the basemap by default. The solid color basemap supports setting the color and basemap coordinate system. The supported coordinate systems are: WGS 84, WGS 84/Pseudo-Mercator, China 2000, Xi-An 1980 China, Beijing 1954. In MapStudio, select the basemap on the left toolbar, and select the map or color label item in the base map sub-panel to select the corresponding base map. After selecting the basemap, you can add the map or data of the corresponding coordinate system as a layer.
Add Layer
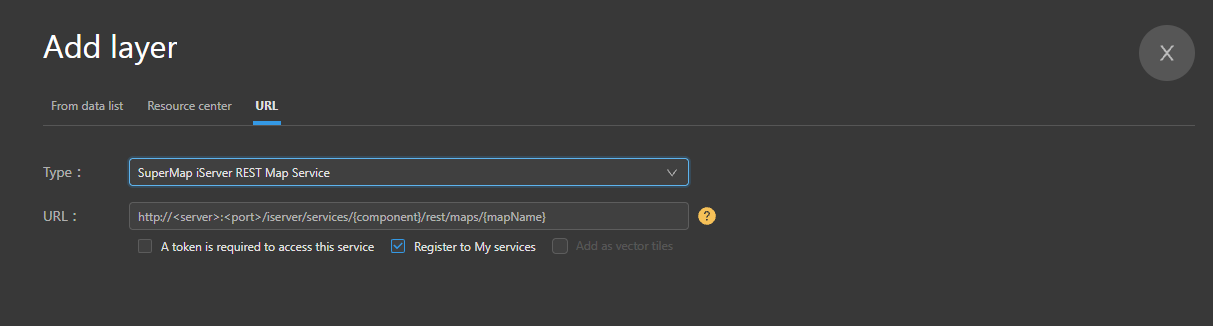
MapStudio supports adding the map service you deployed in Cloud Storage. It should be noted that the coordinate system of the added layer must be consistent with the coordinate system of base map. Click 'Layer' > 'Add Layer' in toolbar on the left, and enter map service address in pop-up panel. You can also directly click 'My Service' to use service you in Cloud Storage.
Add Data
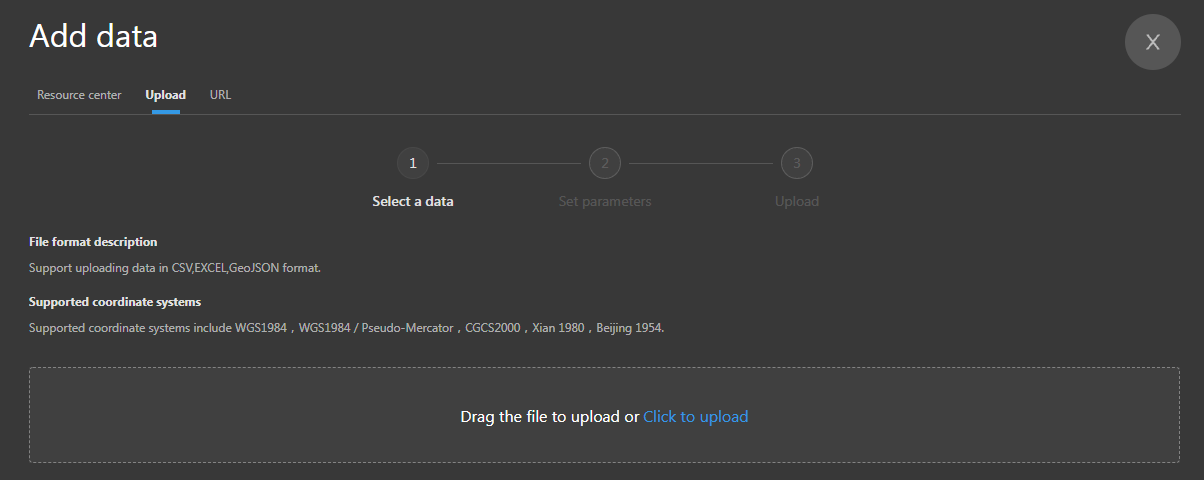
MapStudio supports adding data services that you publish in Cloud Storage. It should be noted that the coordinate system of the added data must be consistent with coordinate system of the base map. Click 'Data' > 'Add Data' in the toolbar on the left, and enter the data service address in pop-up panel. You can also directly click 'My Data' to use data that upload in Cloud Storage. You can add data through 'Upload Data' also. After uploading is complete, the uploaded data will be listed in 'Data' panel. Move the mouse to the data record and click the 'Add to Map' button to add the data to current map. The data added by uploading can be further spatially analyzed.
Change Layer Properties
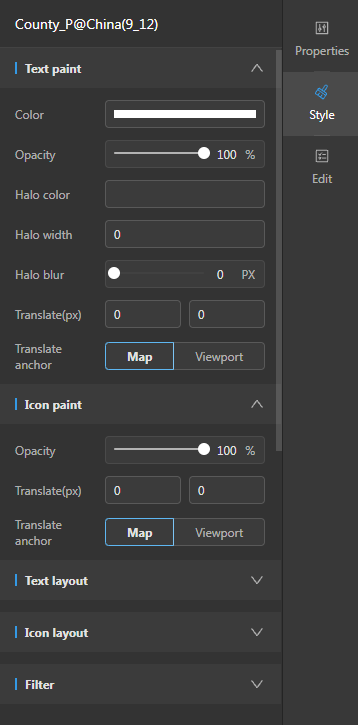
Click the data you added to layer, you can modify the style of data in toolbar on the right, and you can also use the current data to make a thematic map.
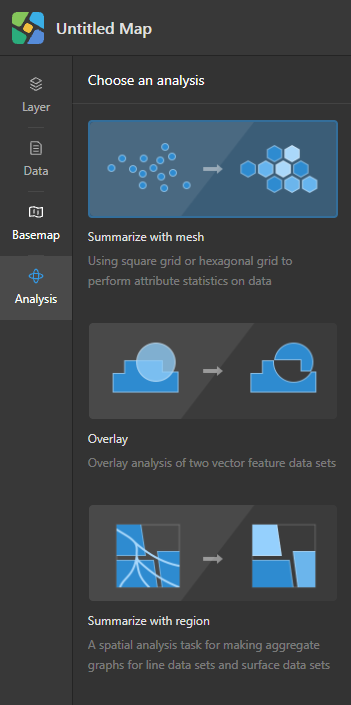
Analyze Data
You can perform grid summary and overlay analysis on the data added by 'Add data-upload'. Click 'Analyze' and select analysis type to analyze the data.
Save and Share
After the production is completed, click the save button in the upper right corner to save the current map. Click share button in the upper right corner to modify the sharing permissions and share map with others.