MapDashboard
The MapDashboard adopts drag-and-drop free layout, and full graphical editing with no coding. The dashboard application is composed of multiple visual components, such as: maps, scenes, charts, indicators, text, etc. The general process of creating a dashboard includes: Create Project, Add Components, Design Components, Preview, Save and Download.
Create Project
You can click the MapDashboard in the application center, and click 'Get Started' on the pop-up page. You can also click 'Resource Center' > 'MapDashboard' > 'Create MapDashboard' to open the MapDashboard. In the resource center, you can view or edit the dashboard you have saved. On the pop-up page of choosing a dashboard, you can directly select a dashboard template, or click 'New' to start building an exclusive MapDashboard application from scratch based on a blank canvas.

Add Components
The MapDashboard WebApp provides a rich library of visual components, including maps, layouts, map sub-components, charts, common, data, tools, etc. You can directly add components to the dashbord by dragging interactively.

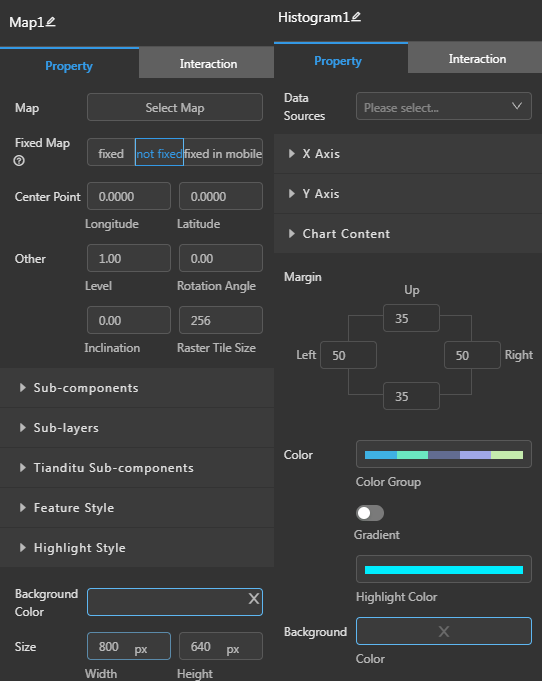
Design Components
Click components on the dashboard to set the content and interaction of the component on the right toolbar. You can add the map you creates in DataViz, you can also add the data you uploaded and services you published in Cloud Storage.
Preview, Save and Download
MapDashboard can automatically adapt to the PC, Web and mobile terminals. You can resize the dashboard size by clicking on the upper navigation bar, or you can set the dashboard size by yourself. After setting, click the 'play' button to preview.

After making the dashboard, click the 'save' button in the upper right corner to save the current dashboard. After saving the dashboard, you can get the sharing link by setting permissions in the 'Resource Center' > 'My MapDashboard'. You can also click the 'download' button to download the source code of the dashboard to the local as a compressed package to deploy the dashboard application offline.