DataViz
The general process of the data above map is Create a new DataViz, Select base map, Add layer, Define layer style, Save the map and share, use the map on the web page. You can add layers according to your specific needs, such as: Add From File, Add From Search, Add From Web, or Add Marker Layer to draw points, lines, and areas directly, and add annotations.
Create a New DataViz
You can click DataViz in App Center, and click "Get Started" on the page. You can also click "Resource Center", "Map", and "Create Map" to open the DataViz. In the resource center, you can view or edit the data you saved in DataViz.
Select Base Map
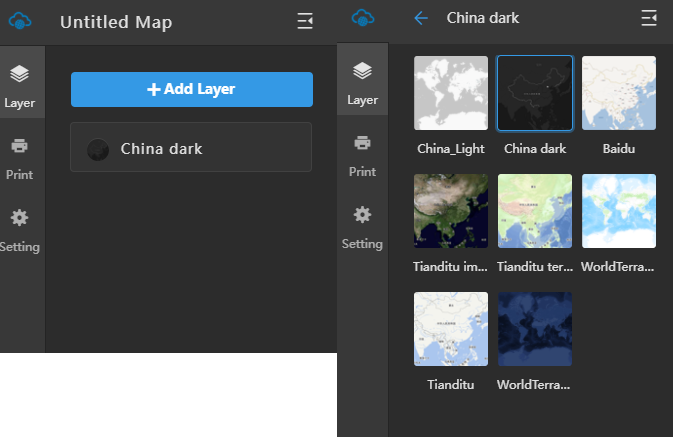
When using the DataViz for the first time, the default map is the built-in dark map of China in the system. You can click the "China Dark" layer, select and change the base map in the toolbar.
Add Layer
You can add layer from File, Search, Web, or add label layer to draw points, lines, and regions.
Add From File
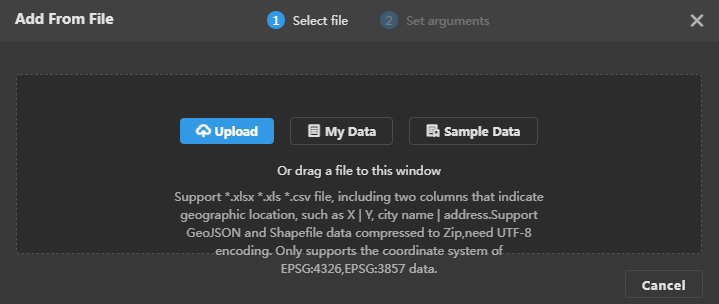
Click "Add layer" and select "Add From File". You can choose to upload files in .xlsx; .xls; .csv format, or you can upload GeoJSON and Shapefile data compressed to Zip. You can find the data you uploaded in Cloud Storage in "My Data". You can also choose to use the sample data that we provided.
Add From Search
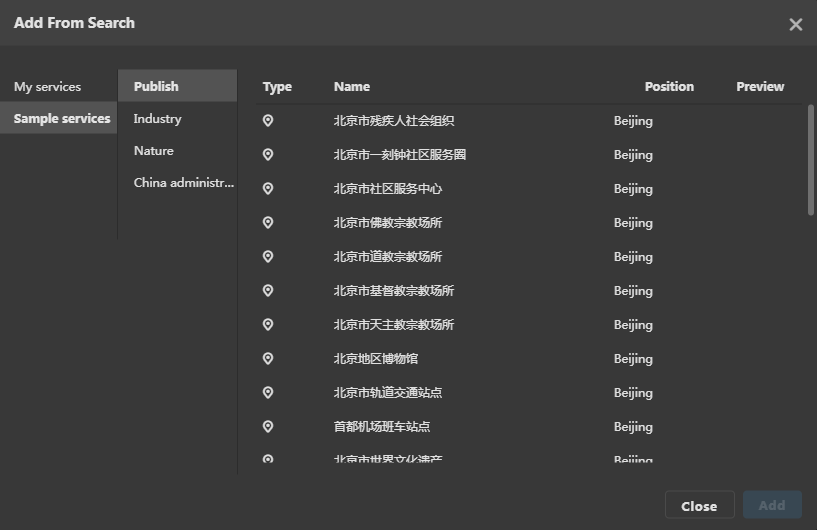
Click "Add layer" and select "Add From Search". You can choose to use the services you publish in Cloud Storage, or you can choose the sample services we provide you.
Add From Web
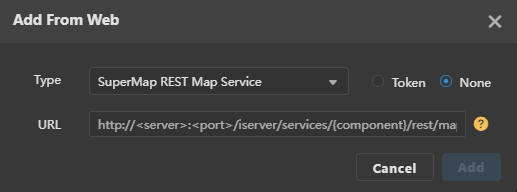
Click "Add Layer" and select "Add From Web". Normally, the address of the map service needs to be accurate to the name of the map you want to add, such as:
https://www.supermapol.com/proxy/iserver/services/map_populationandeconomy_xwjj5a44/rest/maps/%E4%BA%BA%E5%8F%A3%E7%BB%8F%E6%B5%8E. The address of the data service needs to be accurate to the name of the data list. For example:
https://www.supermapol.com/proxy/iserver/services/data_beijingshizhongxue-1-_9wfl70vd/rest/data/datasources/olpg4
  or https://www.supermapol.com/proxy/iserver/services/data_beijingshizhongxue-1-9wfl70vd/rest/data/datasources/olpg4/datasets/datasetcsv_98624561
Add Marker Layer
Click "Add Layer" and select "Create Label Layer". You can choose to create points, lines, areas, and text. After the selection is complete, you can draw on the current map. For the finished label, you can modify the information, style and attributes of the label.

Define Layer Style
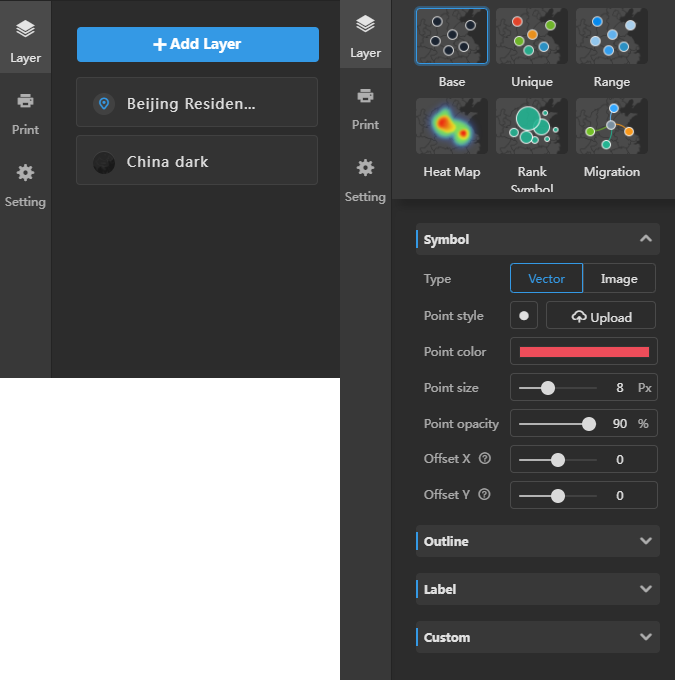
Click the layer you added, such as "Beijing Residential District" in this example, and select the thematic map type. You can also modify the symbol style, symbol outline, and classification method.
Save the Map and Share it
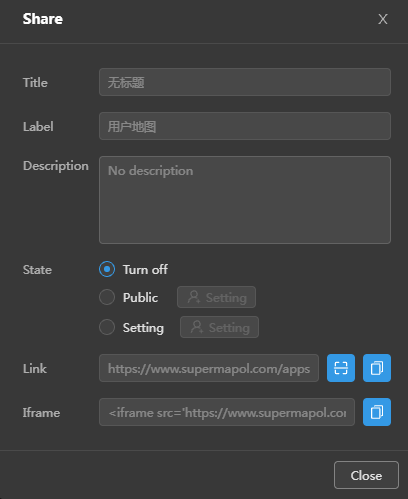
After the production is completed, click the save button in the lower left corner to save the current map. If you want to share the map with others, click the share button and set the sharing permission to share it with others via a link.
Use the Map in Web Page
For the map whose sharing permission is set to public, you can use it directly on your webpage. You can use the map you made with the following code, click to learn more:
<!DOCTYPE html>
<html>
<head>
    <meta charset="UTF-8">
    <link href="https://cdn.jsdelivr.net/gh/openlayers/openlayers.github.io@master/en/v6.1.1/css/ol.css" rel="stylesheet">
    <script type="text/javascript" src="https://cdn.jsdelivr.net/gh/openlayers/openlayers.github.io@master/en/v6.1.1/build/ol.js">
    <link href='https://iclient.supermap.io/dist/ol/iclient-ol.min.css' rel='stylesheet' />
    <script type="text/javascript" src="https://cdn.jsdelivr.net/gh/openlayers/openlayers.github.io@master/en/v6.1.1/build/ol.js"></script>
    <script type="text/javascript" src="https://iclient.supermap.io/dist/ol/iclient-ol.min.js"></script>
</head>
//Insert map
<body style=" margin: 10px;overflow: hidden;background: #fff;width: 100%;height:100%; position: absolute;top: 0;">
<div id="map" style="width: 100%;height:100%"></div>
</div>
<script type="text/javascript">
    new ol.supermap.WebMap(1945334393);
    //The number here is the ID generated by the public map you made. This example is Shandong _ county level administrative zoning map
</script>
</body>
</html>