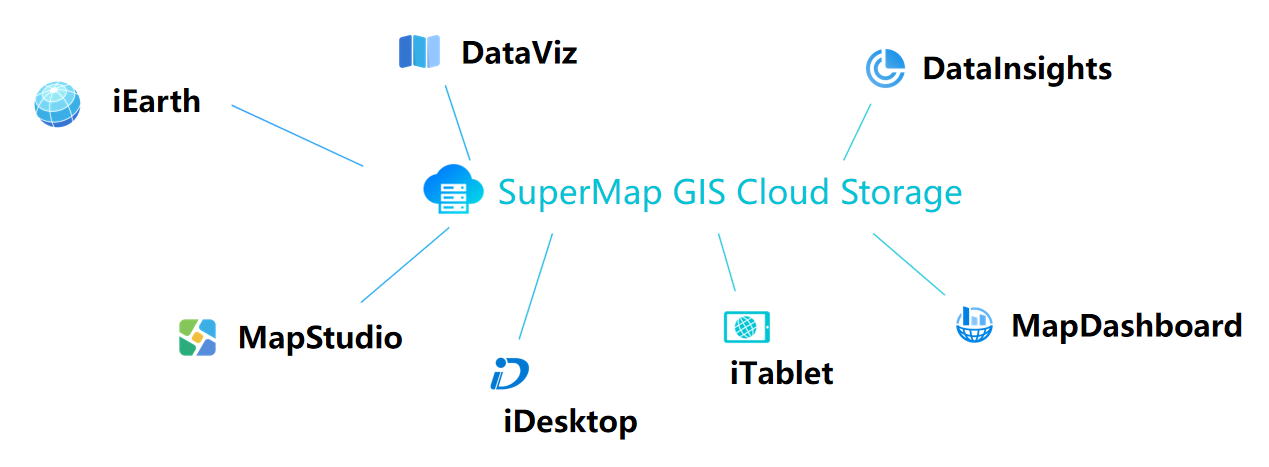
GIS Web Application, Easy to Present Data in Multiple Terminals
SuperMap Online presents several WebApps, which are free to use and allows you to use your data online in a variety of ways. It includes interactive displaying, editing and analysis, without writing code.
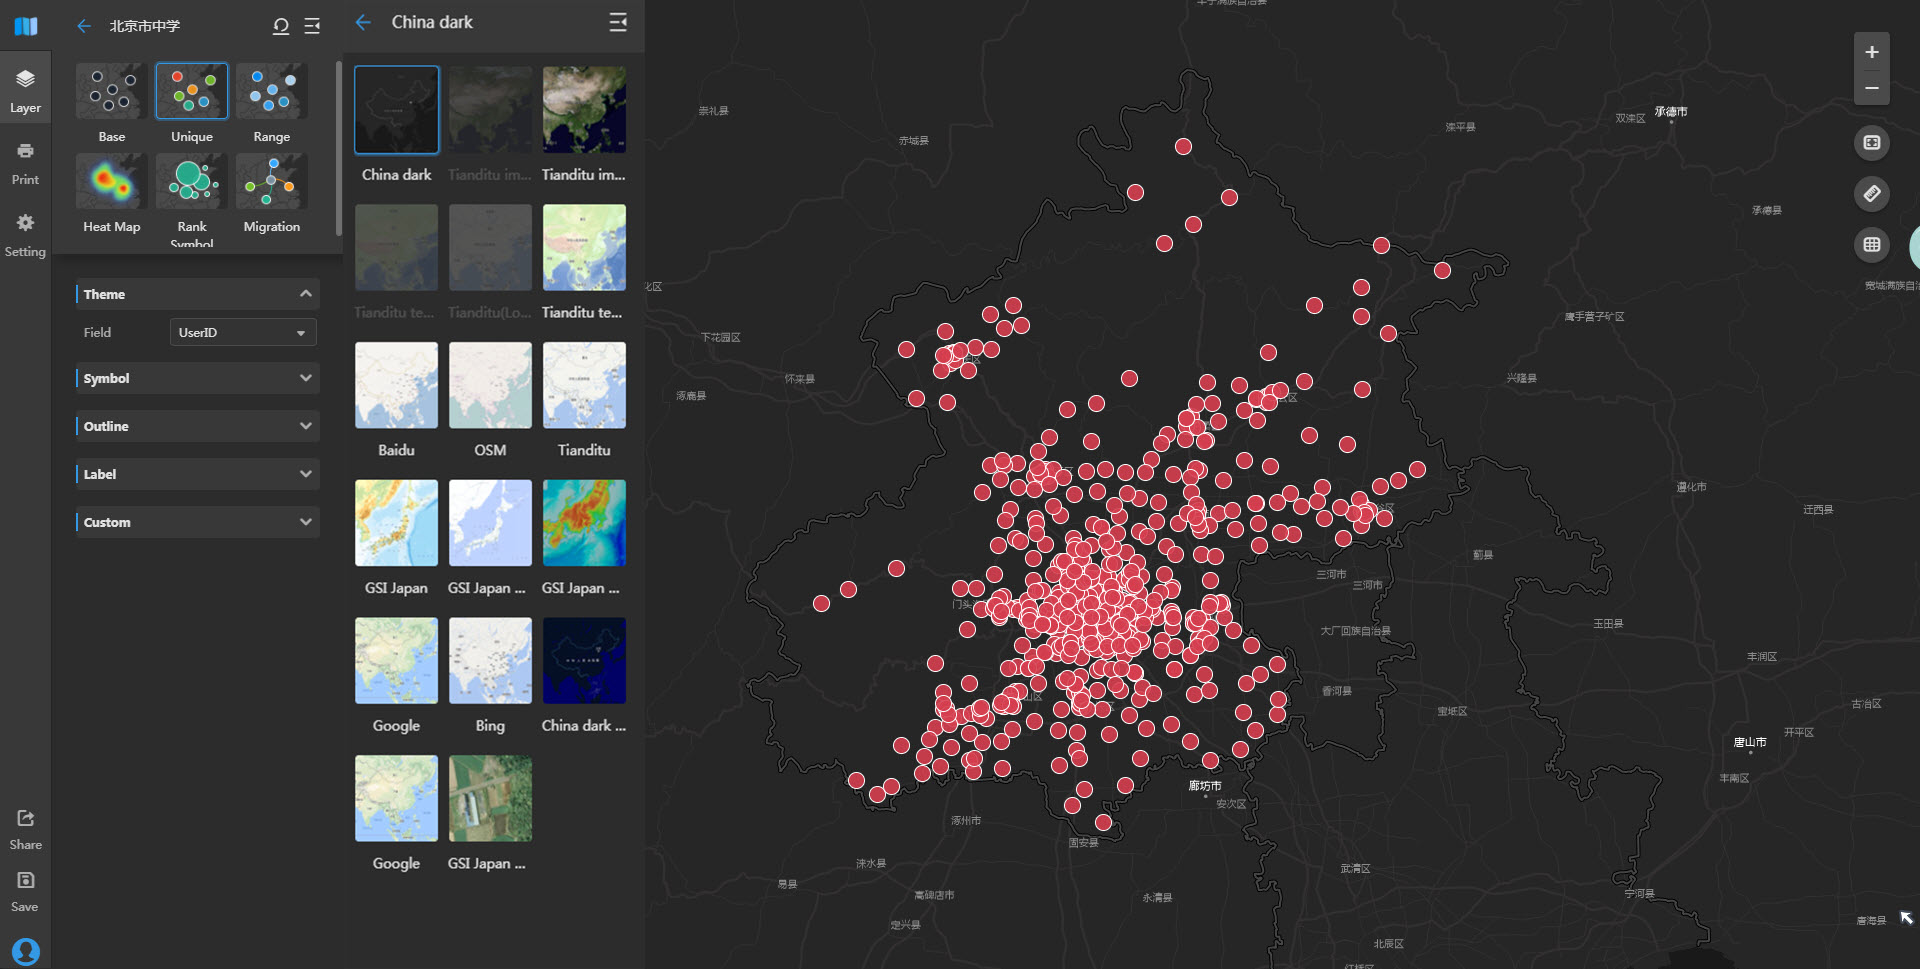
DataViz
DataViz provides several basemaps and thematic maps such as heat maps, range thematic maps, unique thematic maps and other different thematic styles, which can help you upload data and REST services quickly to create different thematic maps. In addition to the data stored in the GIS cloud storage, you can also add other web layers or upload data files to the base map. You can create label layers to edit data online, including adding, deleting, and modifying feature information.
You can easily embed your maps results in web pages or other applications. It can be shared through QR codes or other social tools.
DataInsights
DataInsights is a tool used for data analysis and help to build online interactive analysis of geographic data. You can use the professional GIS analysis tools such as buffer, contour, interpolation, etc. to investigate and mine your spatial information. You can also use statistical analysis approaches such as histogram, pie chart, radar chart, box chart, word cloud, etc. Consolidating GIS spatial analysis with statistical analysis, you can discover the mystery of the data together. At the same time, you can export all analysis results as an intuitive results report that you can share them online or download them.
MapDashboard
MapDashboard is a quick, flexible and visually rich Web application for geographic data visualization. It provides portal data access, interactive data visualization and other capabilities. With rich style settings, it is convenient for you to quickly create 2D/3D map applications online, and display geospatial data in a clear way. You can use the templates and add data to create a map dashboard, or you can design your own templates by adding components. It support to use map services that you create by DataViz, or creat charts online. You can save and download the dashboard result, or share it through QR code and view on the mobile terminal. 
iEarth
iEarth is a no plug-in online 3D visualization platform. You can load 3D data you saved in 3D scenes, including Oblique photographic model, artificial modeling models, BIM and many other 3D data. Meanwhile, it provides some easy-to-use online 3D analysis tools, including visibility analysis, visual domain analysis, shadow rate analysis, etc. You can save your created 3D scenes online and share them with others easily.

Click here to see more details.